Welcome to the second tutorial of HDashboards.
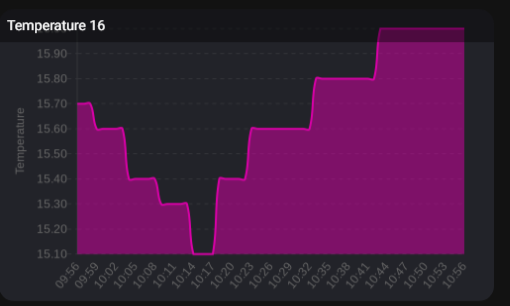
In this tutorial I want to show you how to add Graphs.
Step 1
Make sure the following apps are installed:
- https://homey.app/nl-nl/app/nl.mennovanhout.images/Afbeelding/
- https://homey.app/nl-nl/app/nl.mennovanhout.insights-graphs/Insights-Grafieken/
Step 2
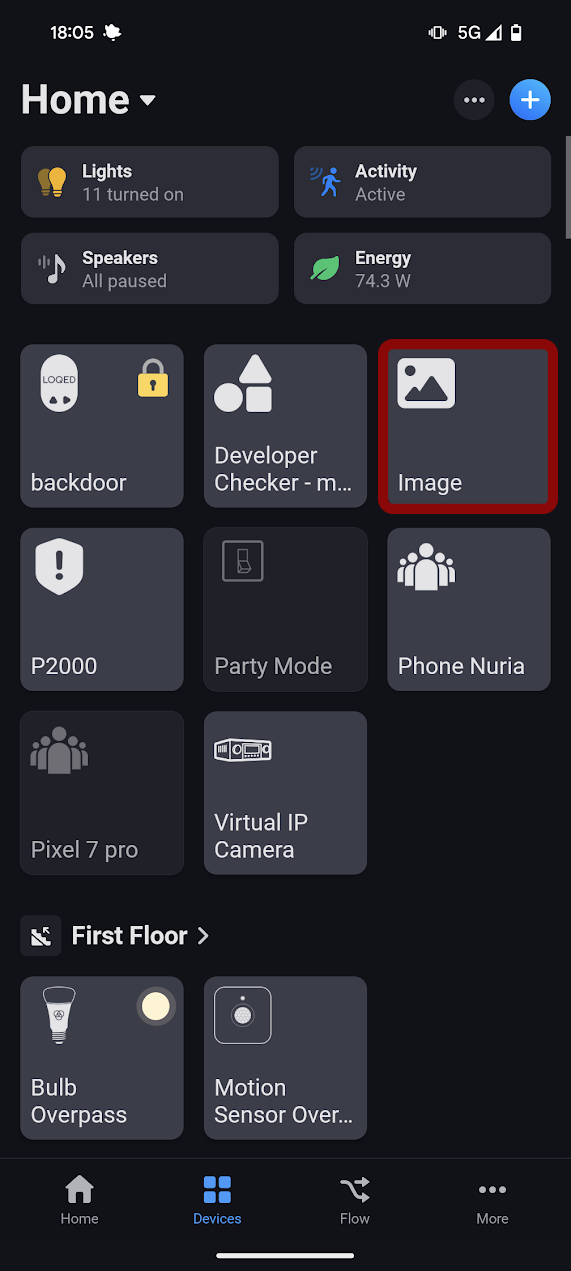
Make sure to have an Images device created with the images app

Step 3
Create a flow like this:

Make sure to use the image card that sets a image token and not the URL one.
I would recommend to keep identifier in lowercase.
The "graph" is only selecatable in the image card AFTER they are connected with the blue line.
After that test your flow this will create the first image
Step 4
Add it to HDashboards! Just open HDashboards in your prefered way: Web, iOS or Android.
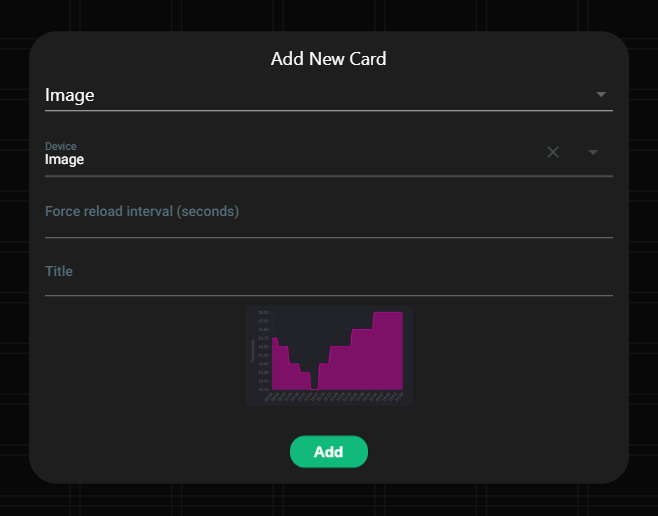
Go your prefered dashboard press edit mode and than add a new card.
Make sure to select images -> your image device and than your graph should already show up. If another image is showing up because you used the image device for other images, don't worry. You can click on the image and change it to the buienradar one. Just press that image.


jan on
Tutorial: Adding Buienradar